You’re creating an Excel graph. All of a sudden you get the bright idea to move it five taps to the right. What happens next is apocalyptic. You cursor focus moves. You delete a series. Invert the axes.
Crash Excel.
Overheat your CPU
And set your desk on fire.
Meh. It happens….walk it off.
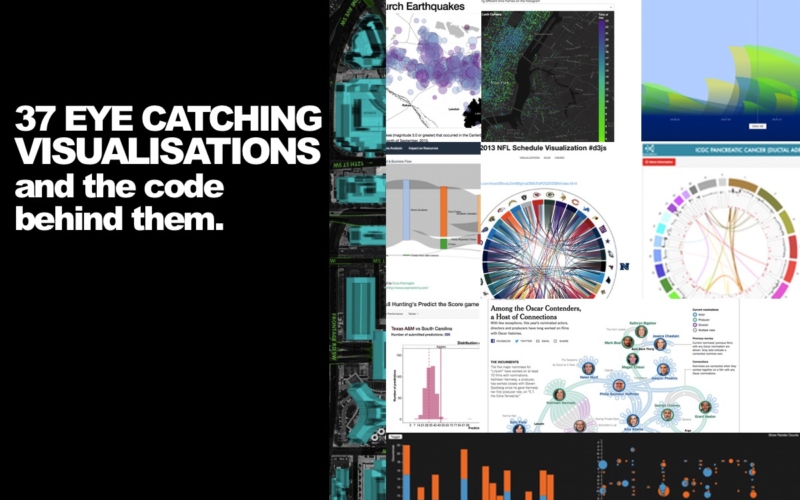
But, if you’re a little over the stock standard out of the box graphing options then your prayers are about to be answered. There’s so much more out there! With a few lines of code (or none at all if you’re using Plotly) you can create eye-catching visualisations like the ones below.
I’ve labeled each grouping based on what package (code library) or platform they’re built on. Why? Because there’s nothing worse than trying to figure out “How did they create that graph?”
Without further adieu, I bring to you 37 amazing visualisations and the stacks behind them….start scrolling…..ah-now.
D3
The D3.js package is by far the most popular package out there. If you can think of it you can create it with D3. The only drawback I found when using it was that there wasn’t a well developed Python wrapper. But hey, if you’re a Javascript wiz then this is the package for you. It was originally created by Mike Bostock while he was working at The New York Times in 2011. Since then he’s used it to weave some of the most mind-bending visualisations you can think of.
1. 512 Paths to the White House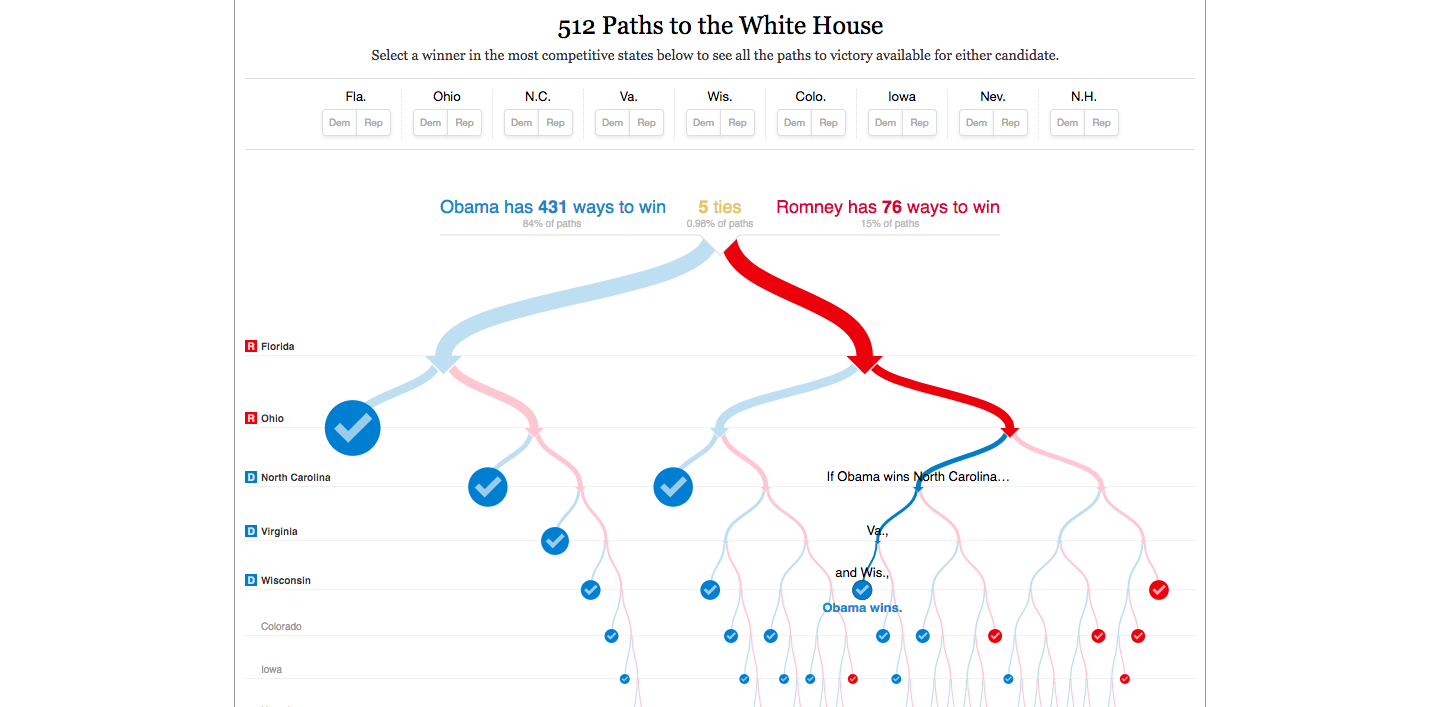
2. Sea of Tweets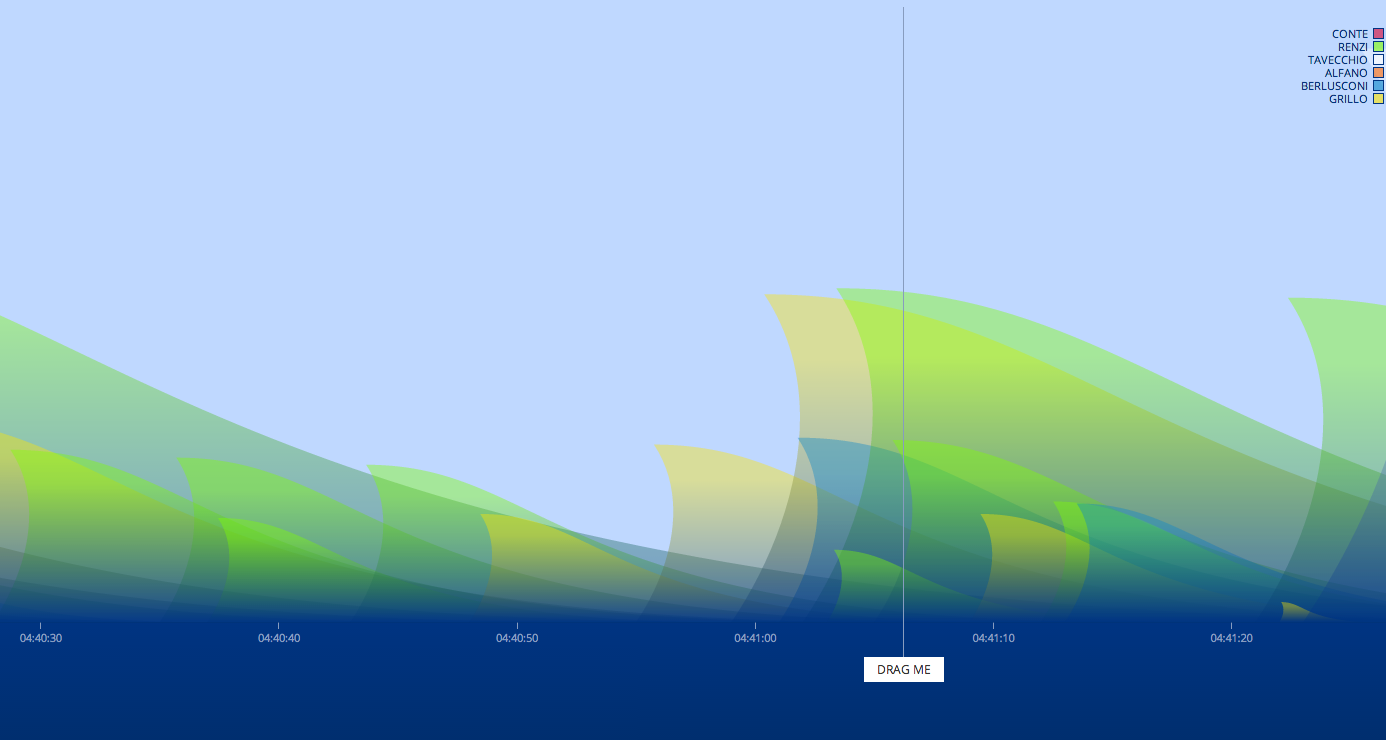
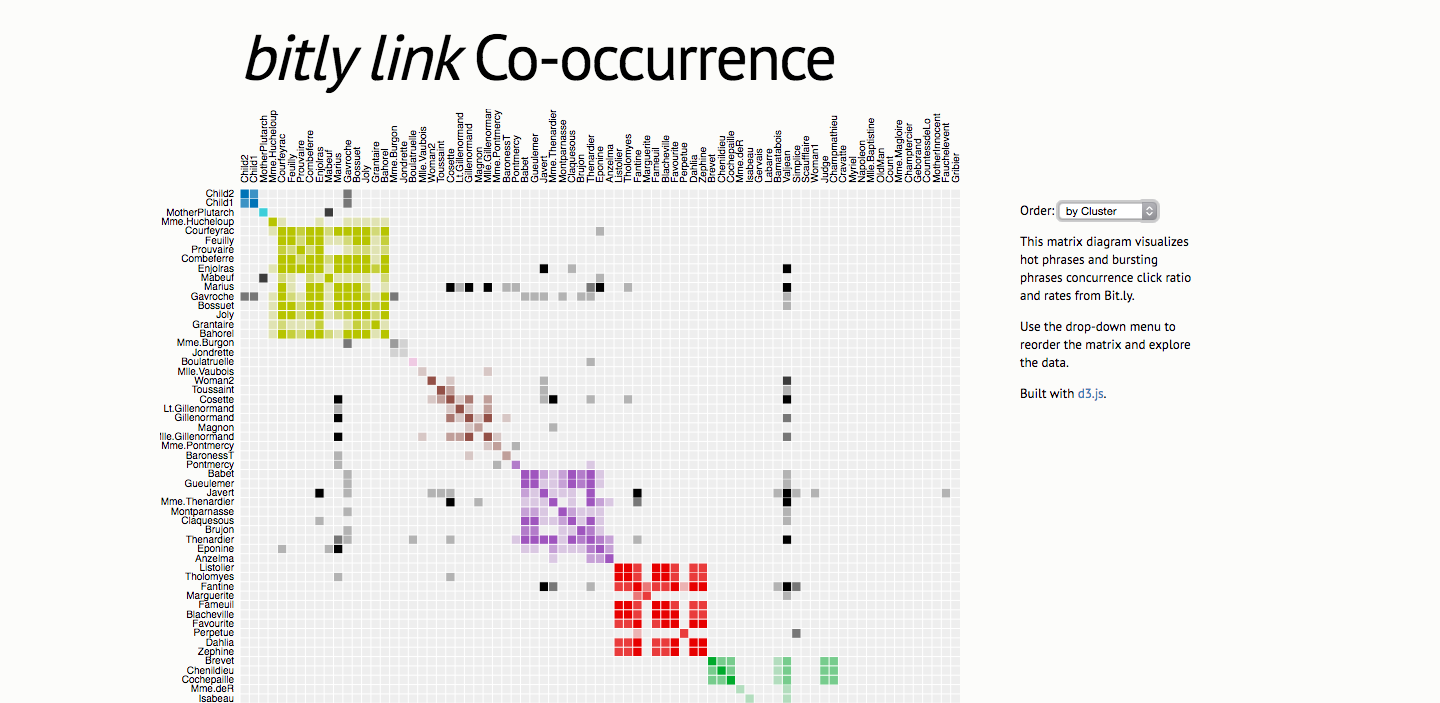
3. Bitly Cooccurence
4. Among The Host of Oscar Contenders
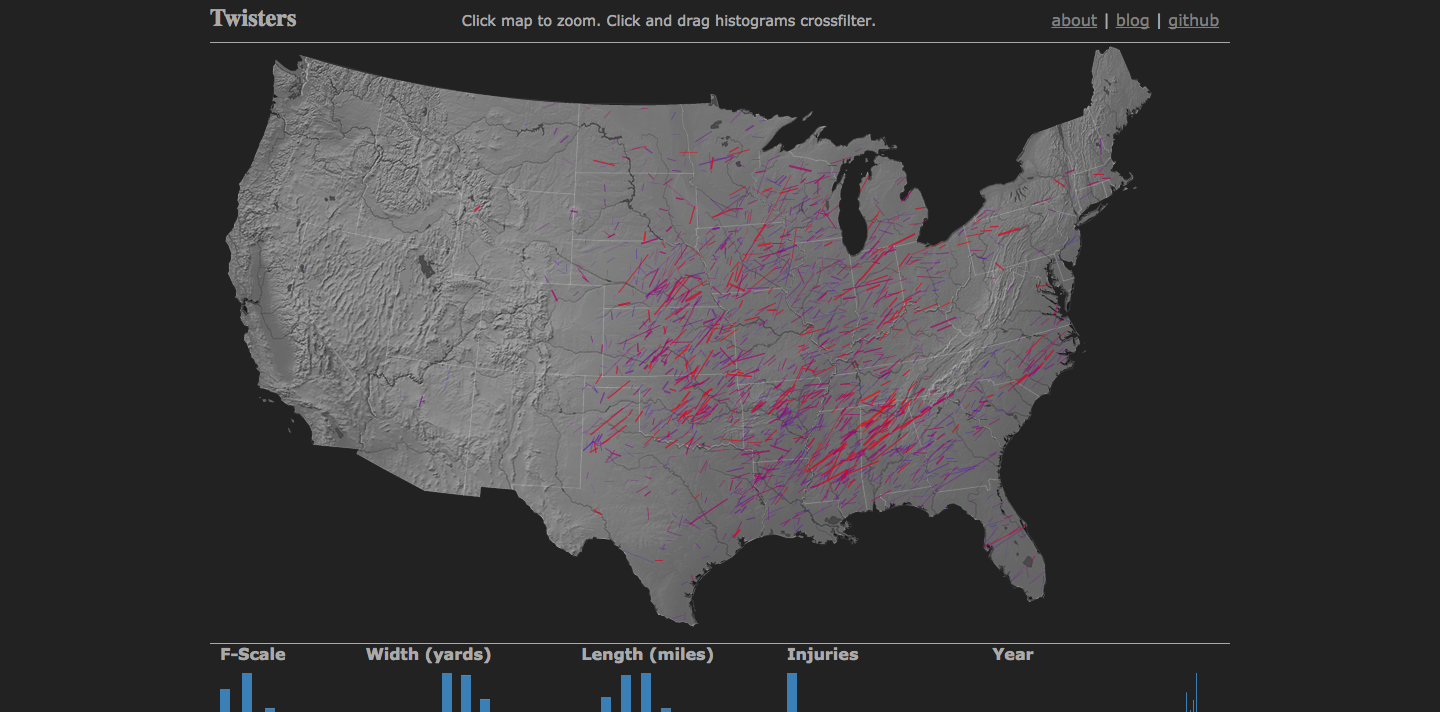
5. Twisters in the US
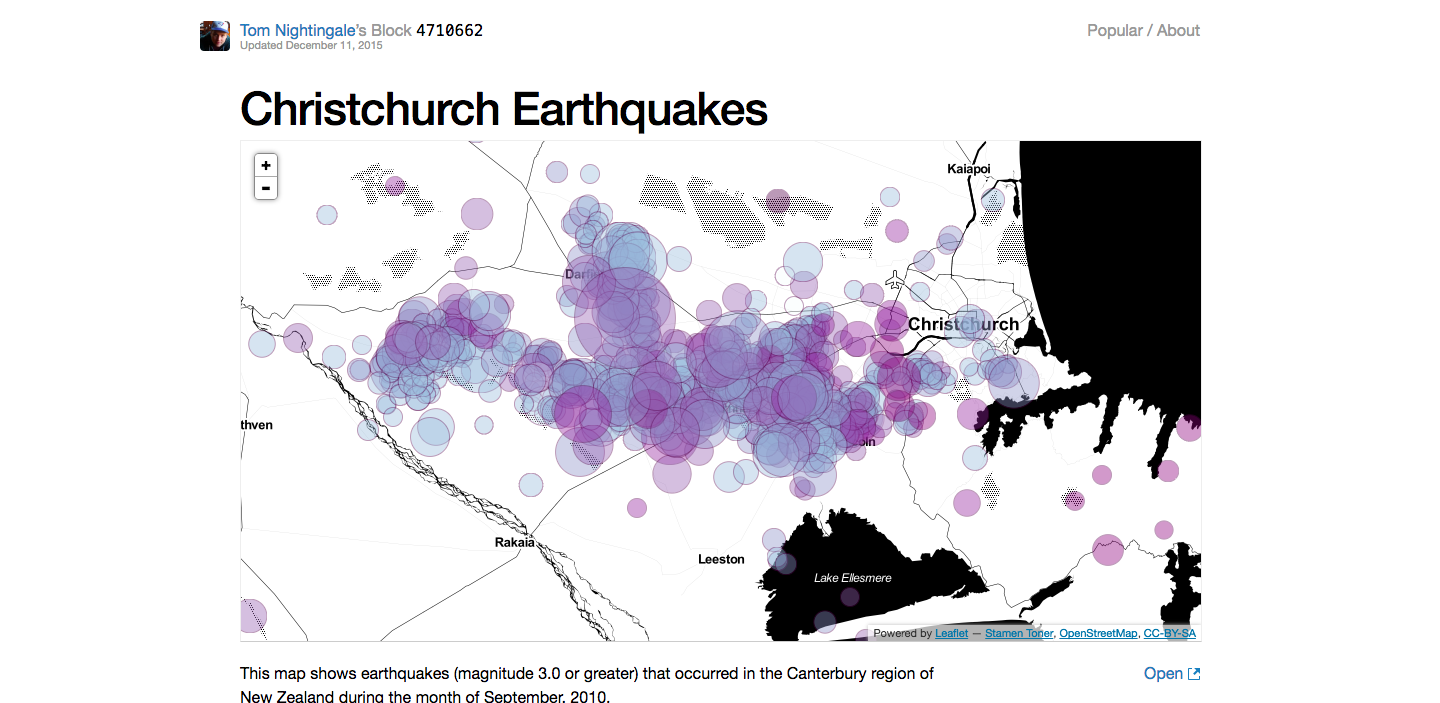
6. Christchurch Earthquakes
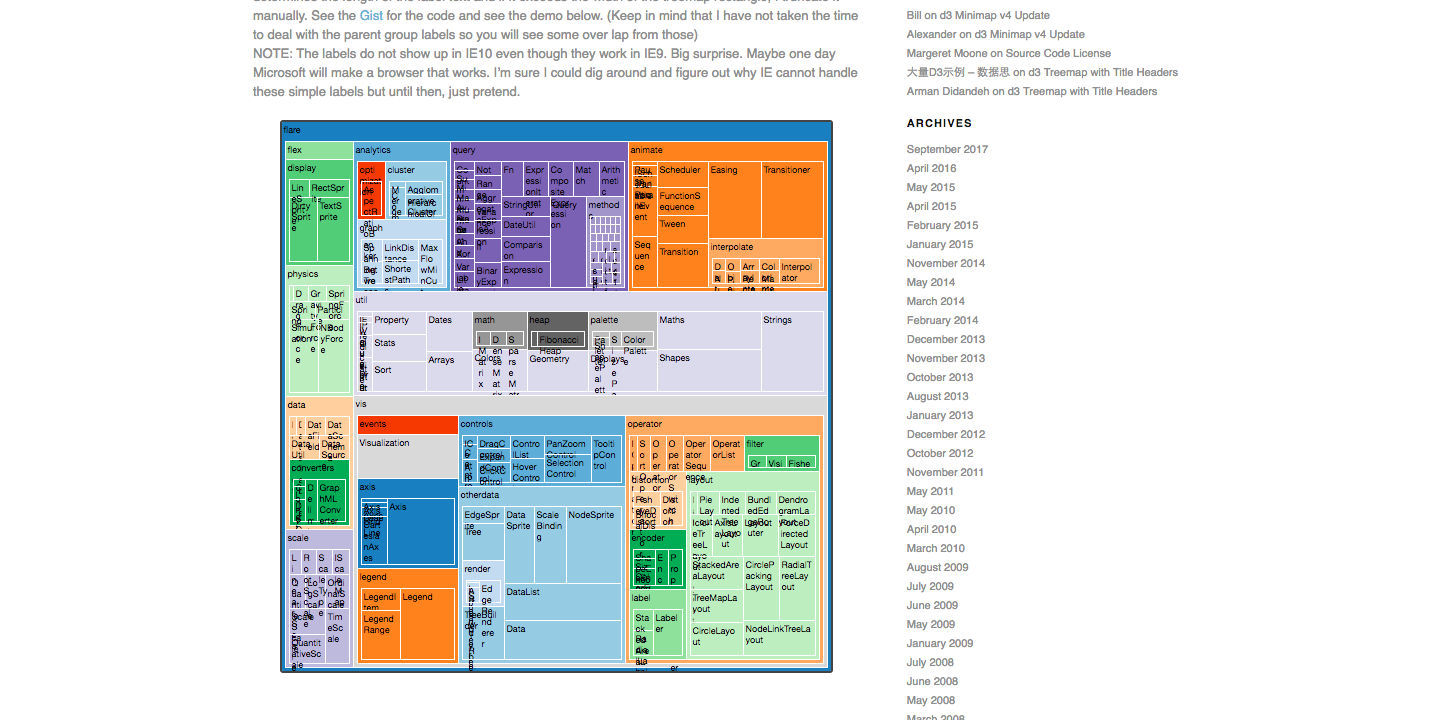
7. Labelled Treemap
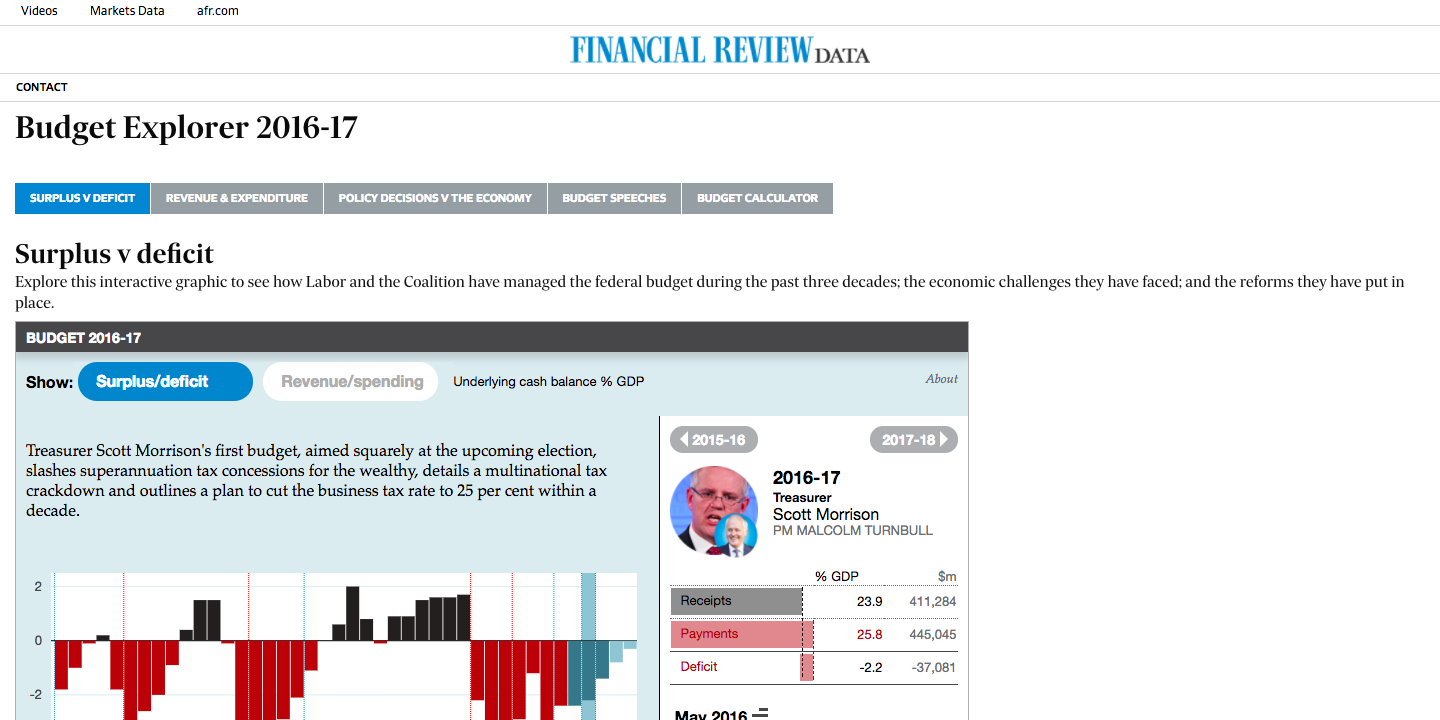
8. AFR Budget Explorer
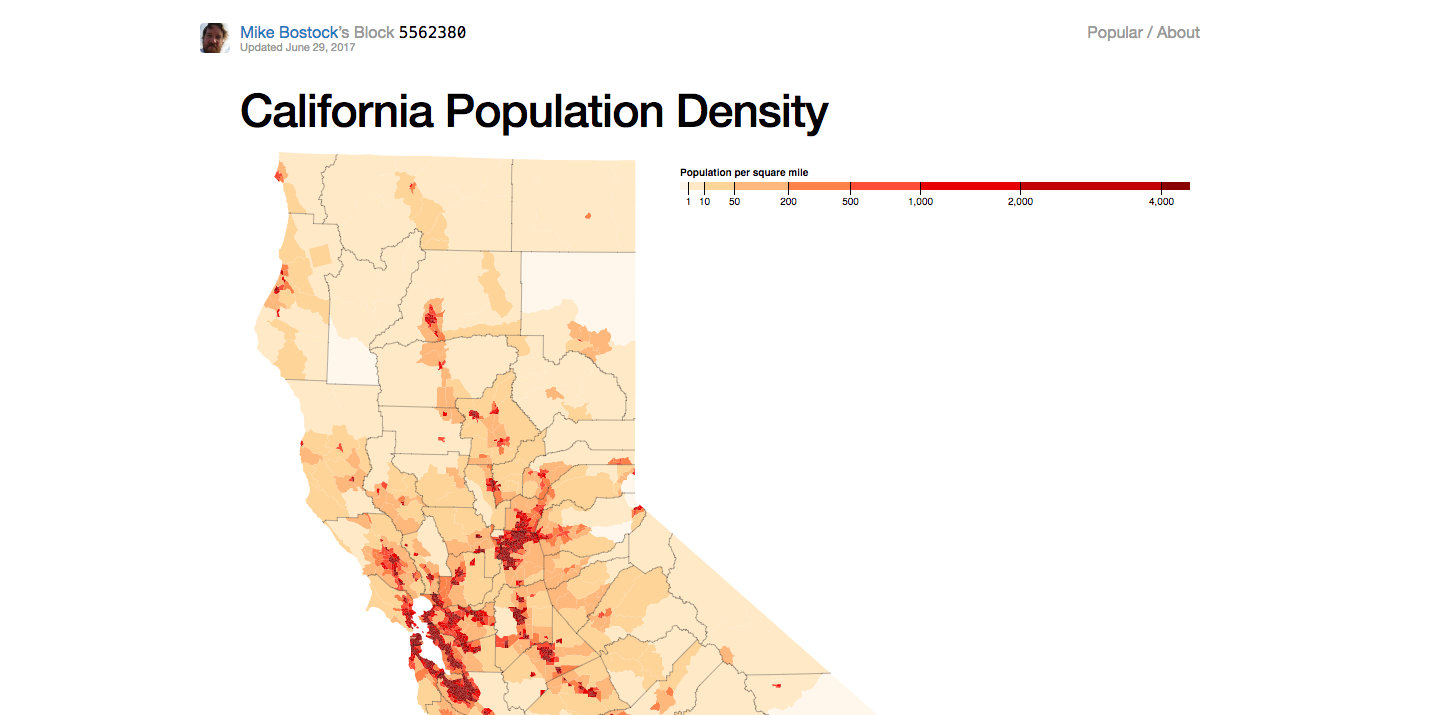
9. Californian Population Density
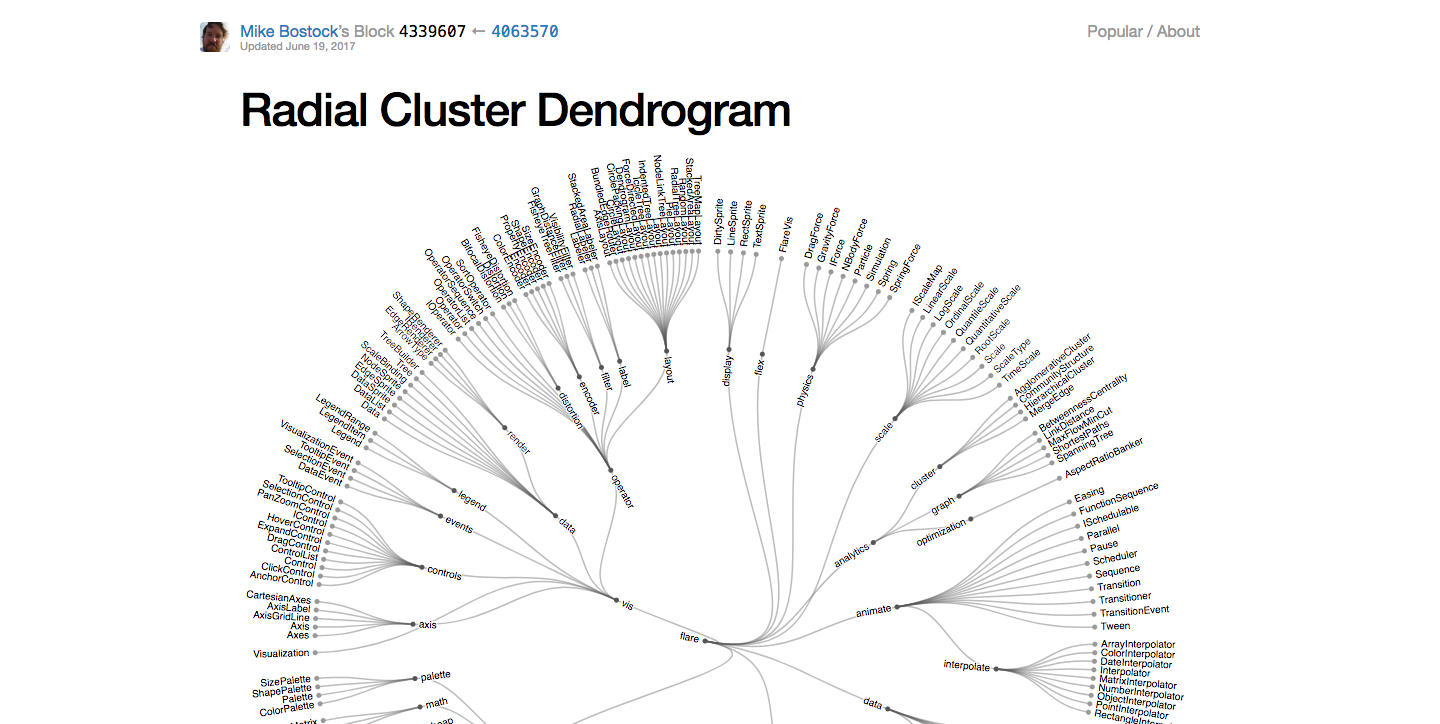
10. Flare Class Hierarchies
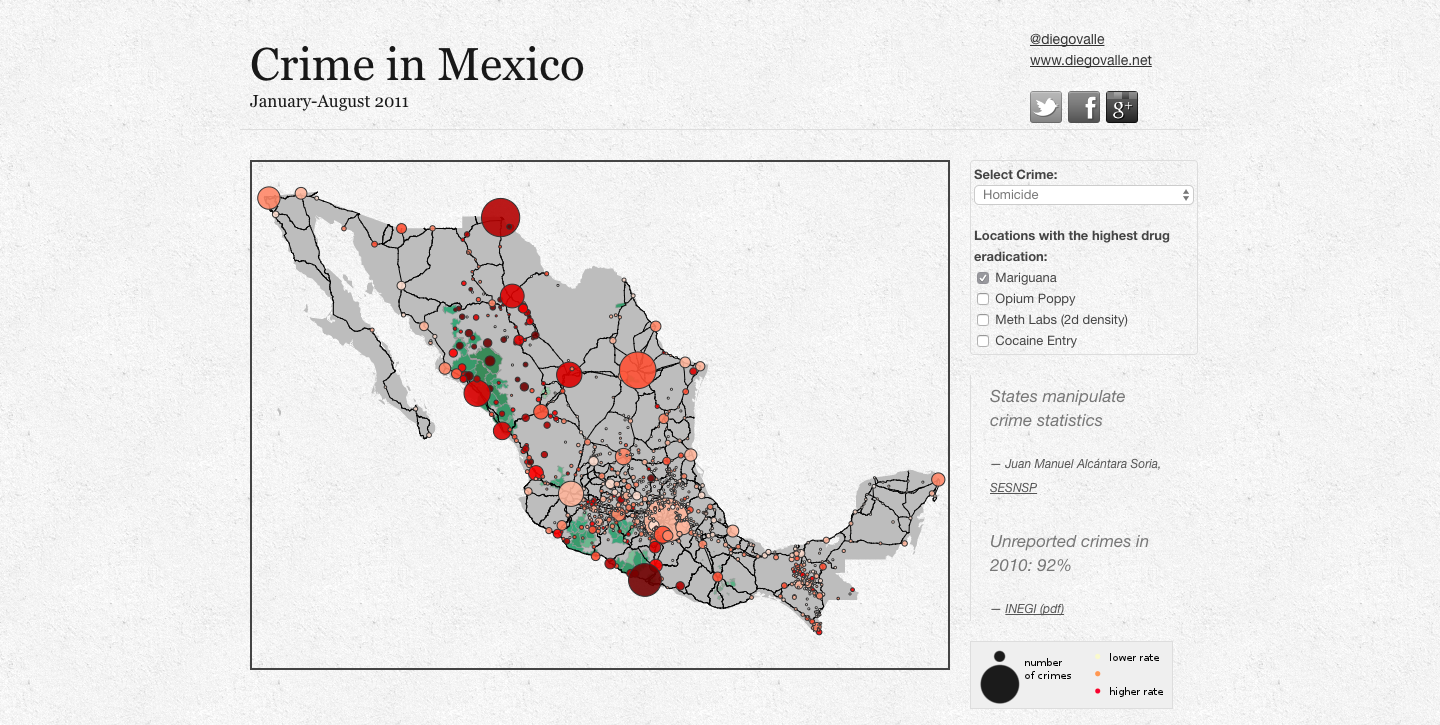
11. Crime in Mexico
12. What do countries look like?
13. Blurred Cities
14. Weekend
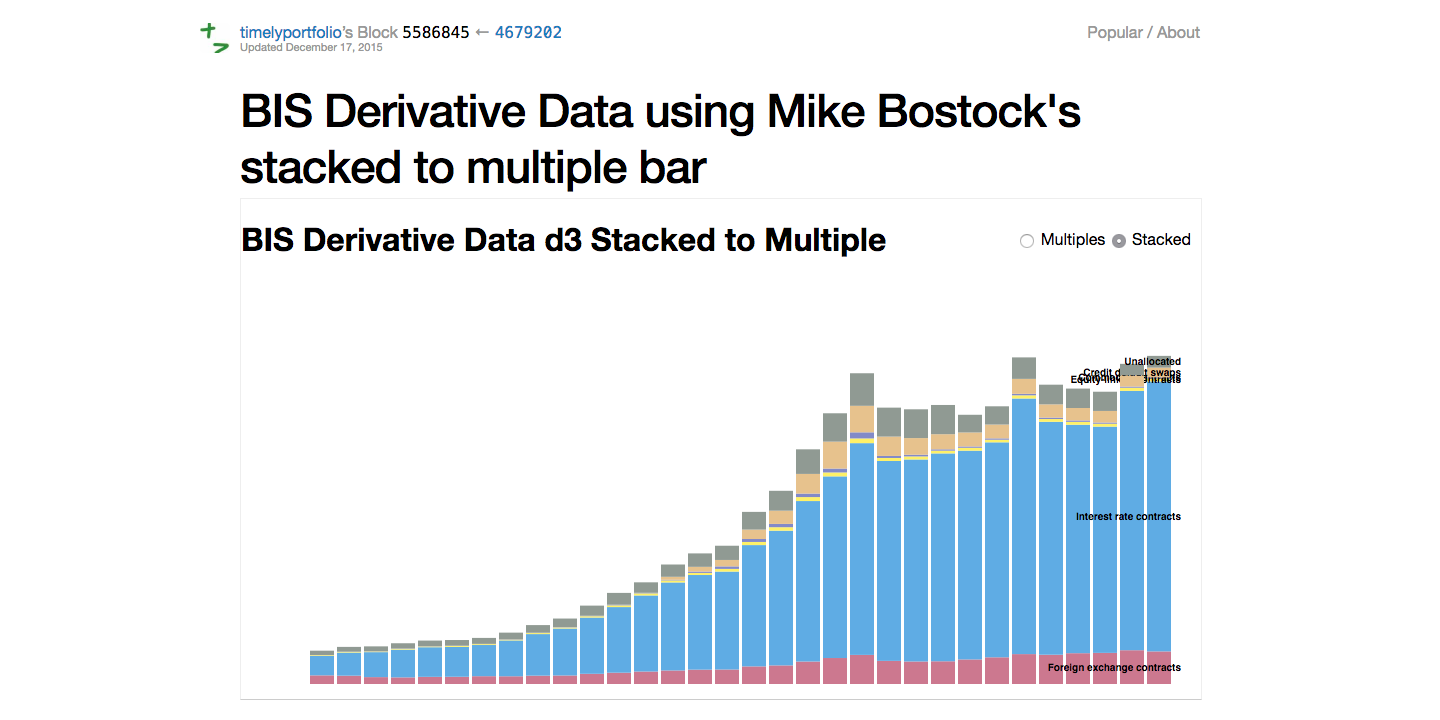
15. BIS Derivative Data
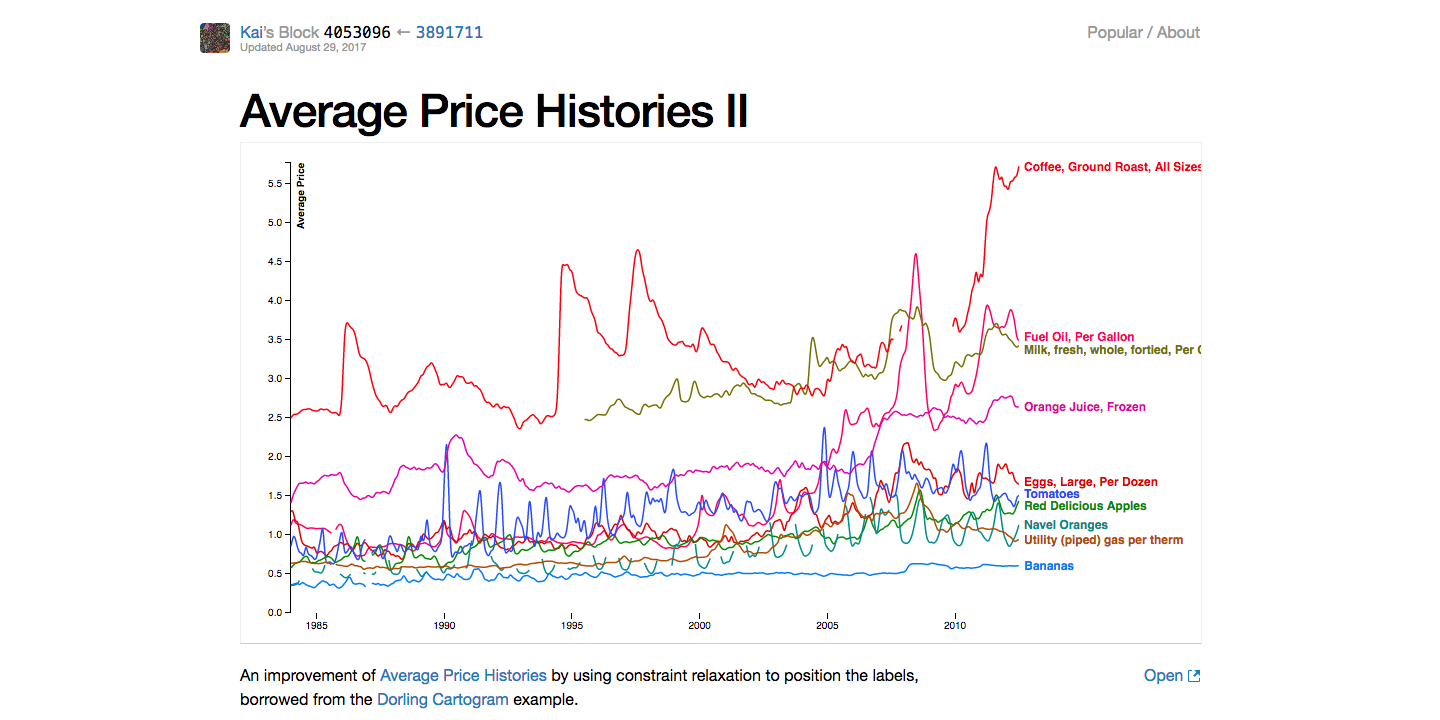
16. Average Price Histories
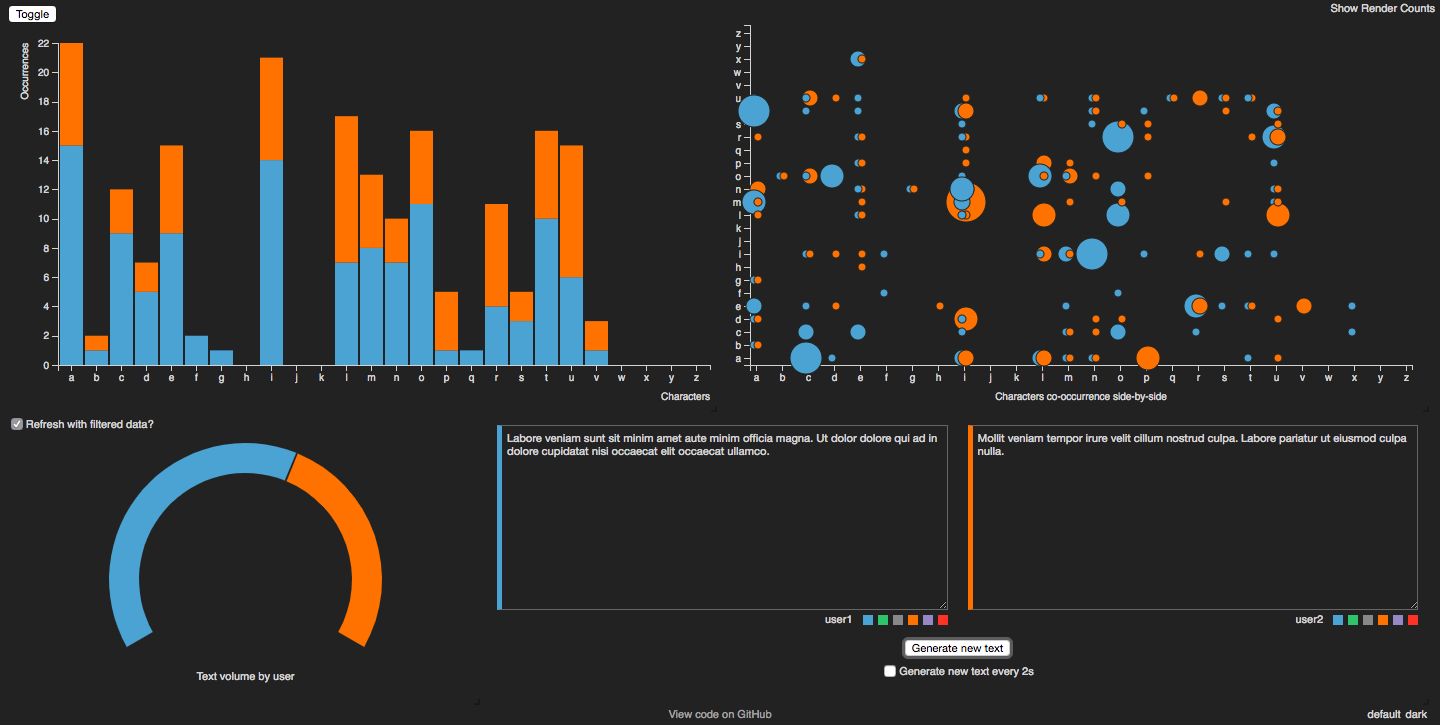
17. Text Analysis Dashboard (React + D3js)
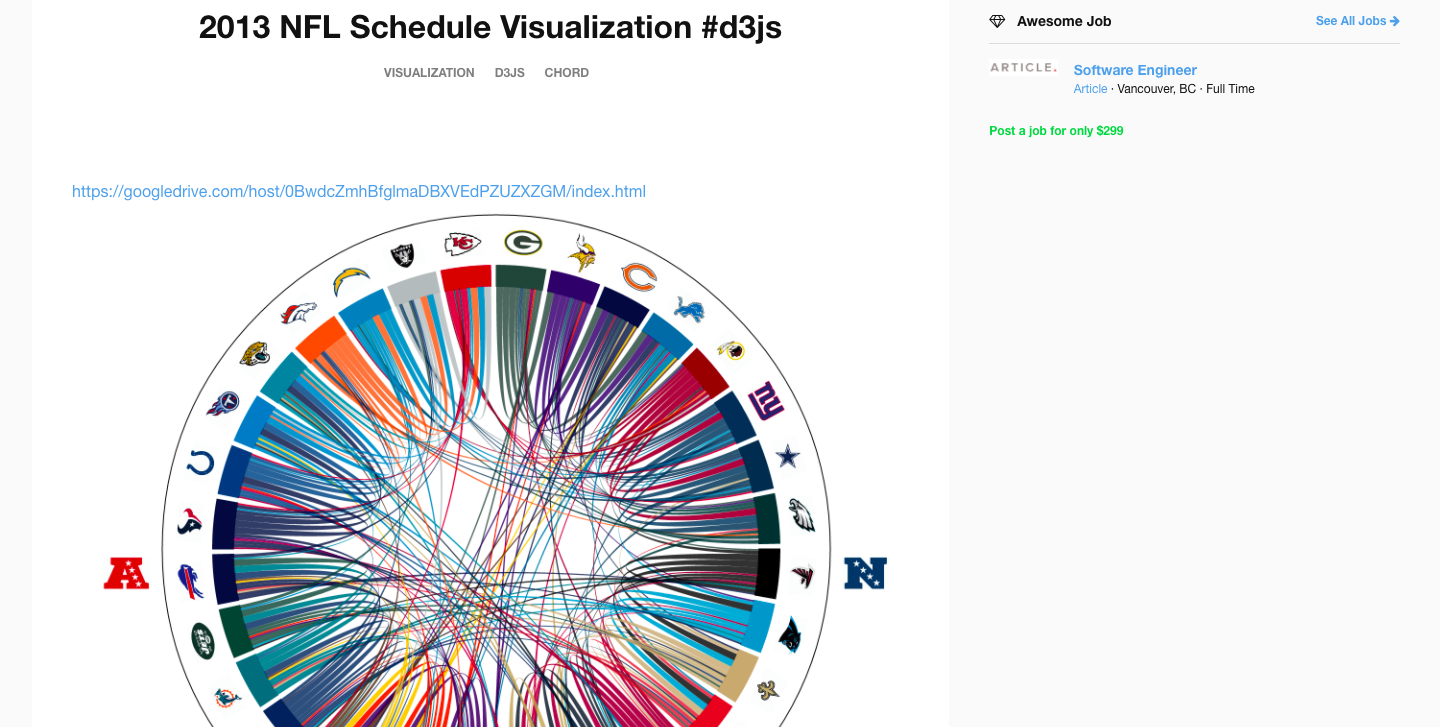
18. NFL Schedule
D3 Shiny Apps
These are broken up from the stock standard D3 apps. This is because these examples have been crafted using shiny, d3 and R. If you’re a fan of R then this is the Holy Grail. You can quickly whip up a Shiny UI and Shiny Server directive and have your visualisations up and running in 5 minutes. Seriously.
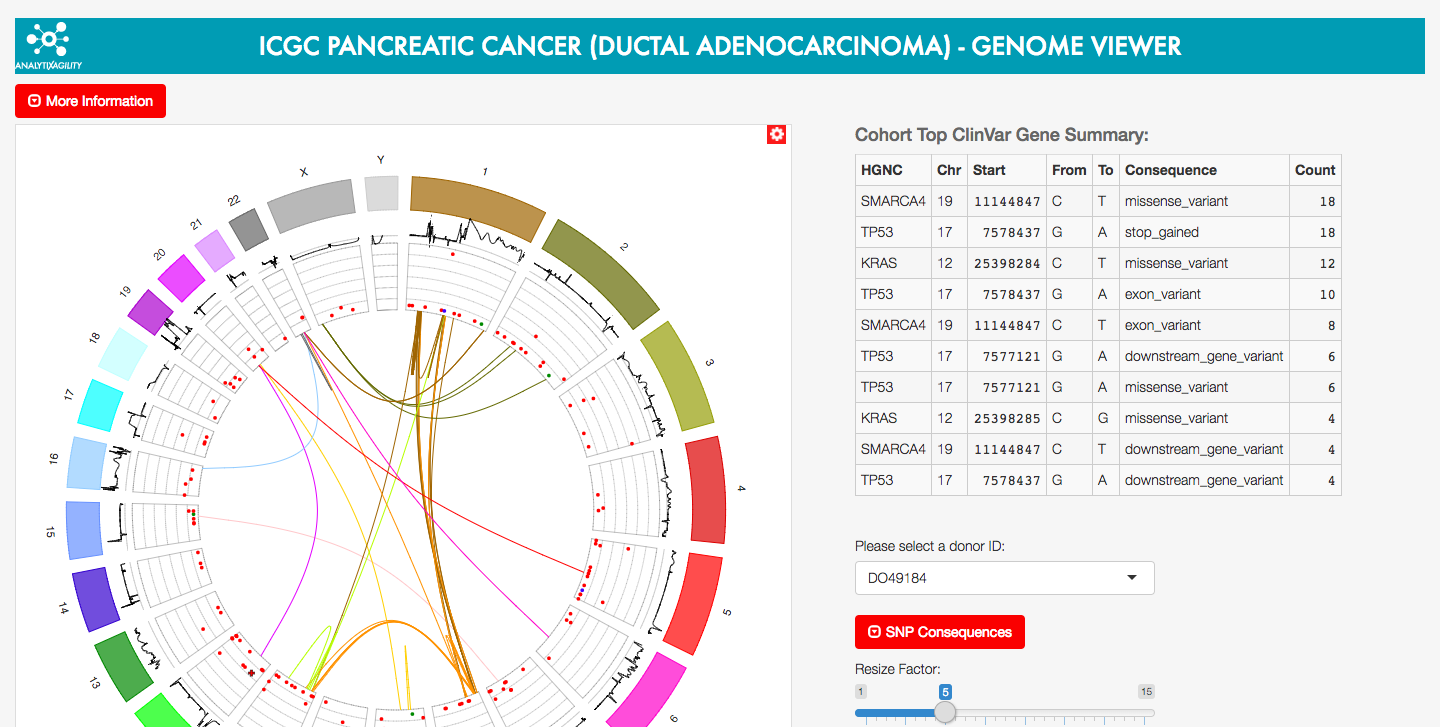
19. Genome Browser
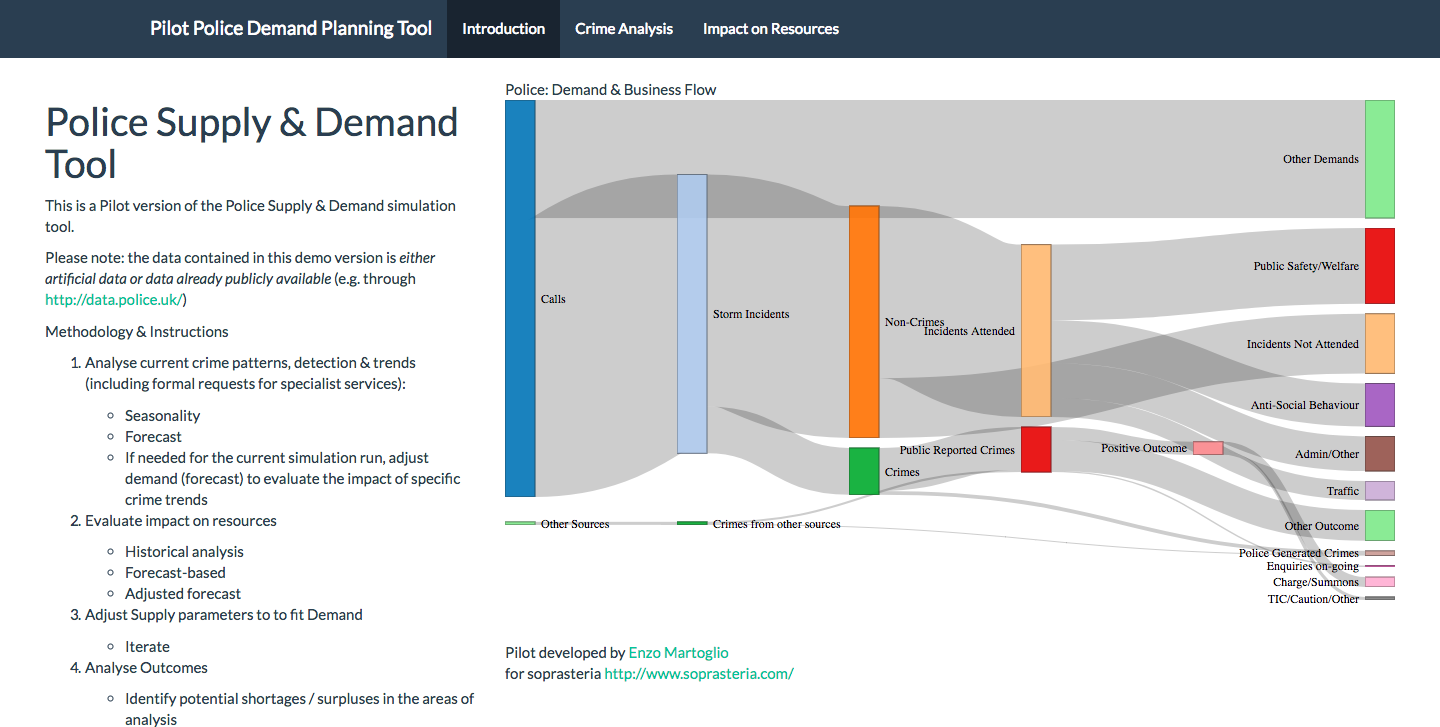
20. Police Supply and Demand Tool
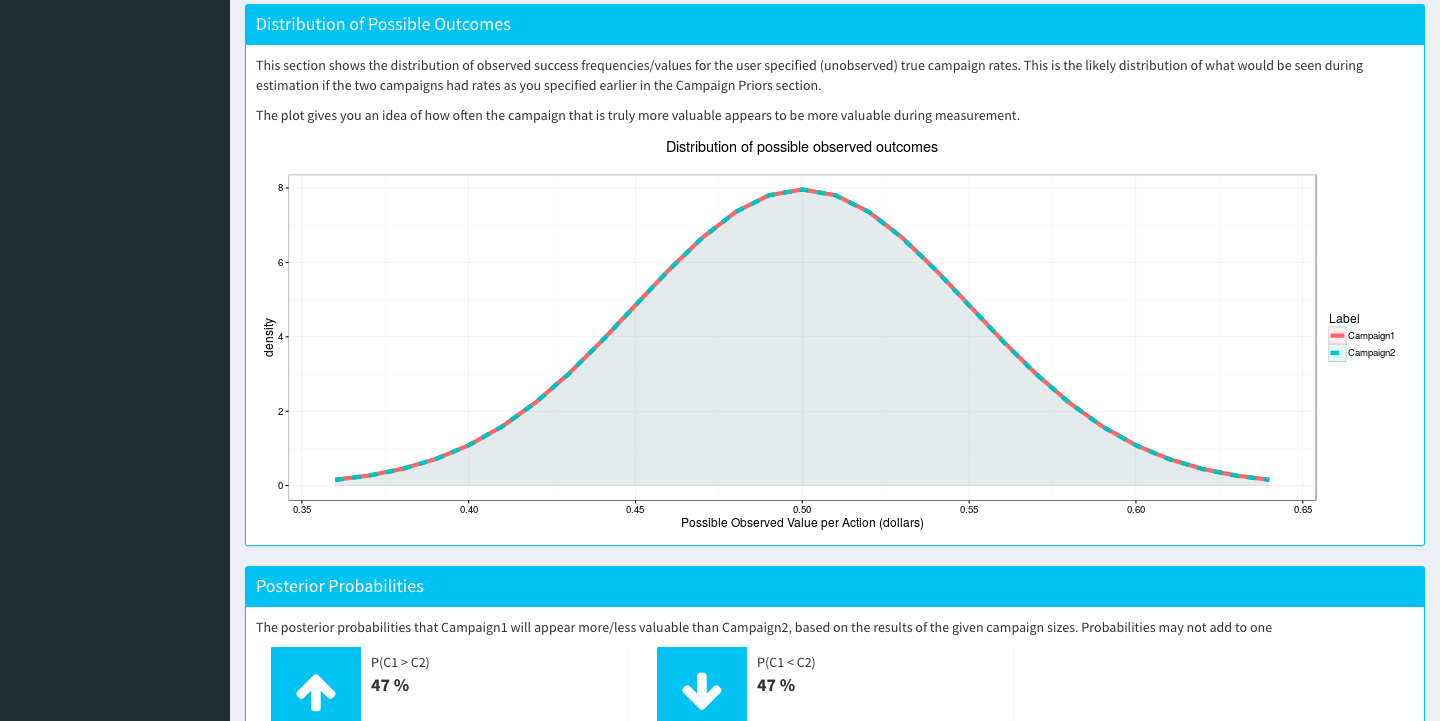
21. A/B Testing Dashboard
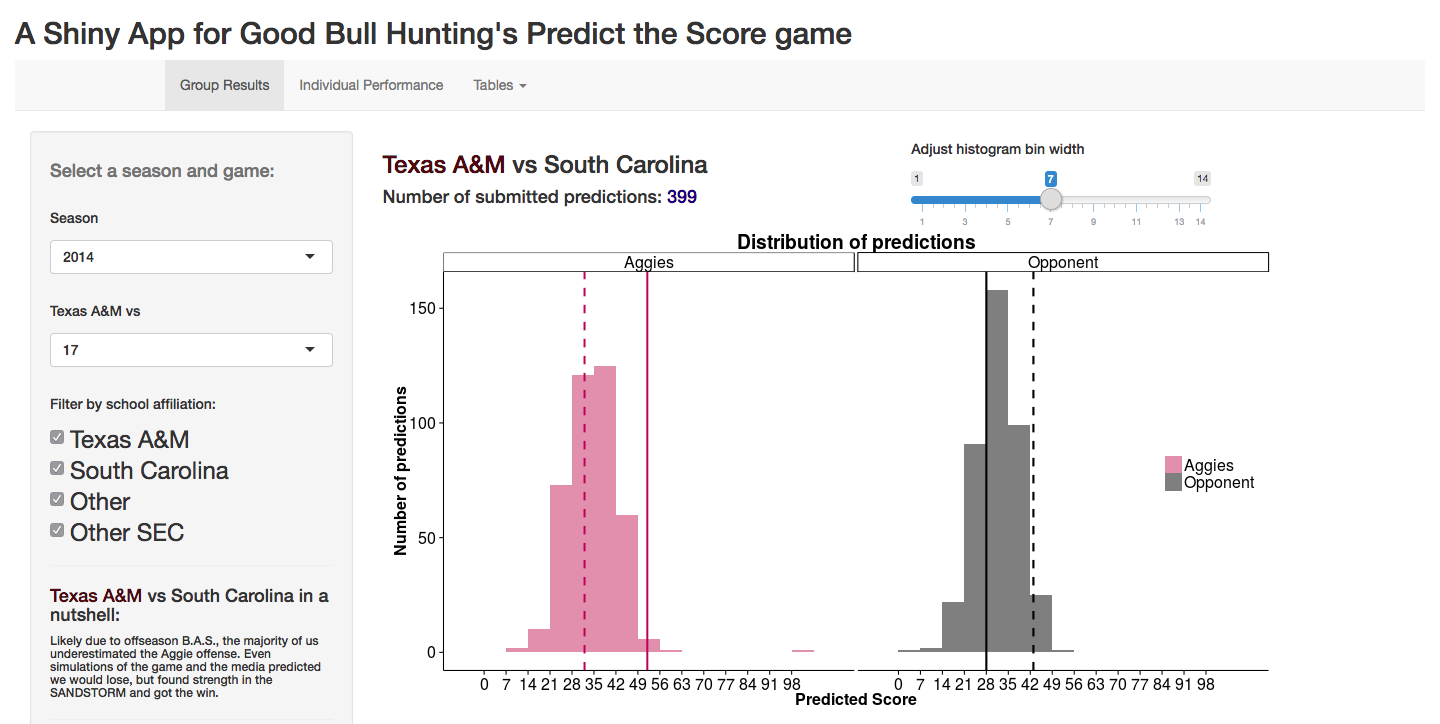
22. Texas A&M Matchups
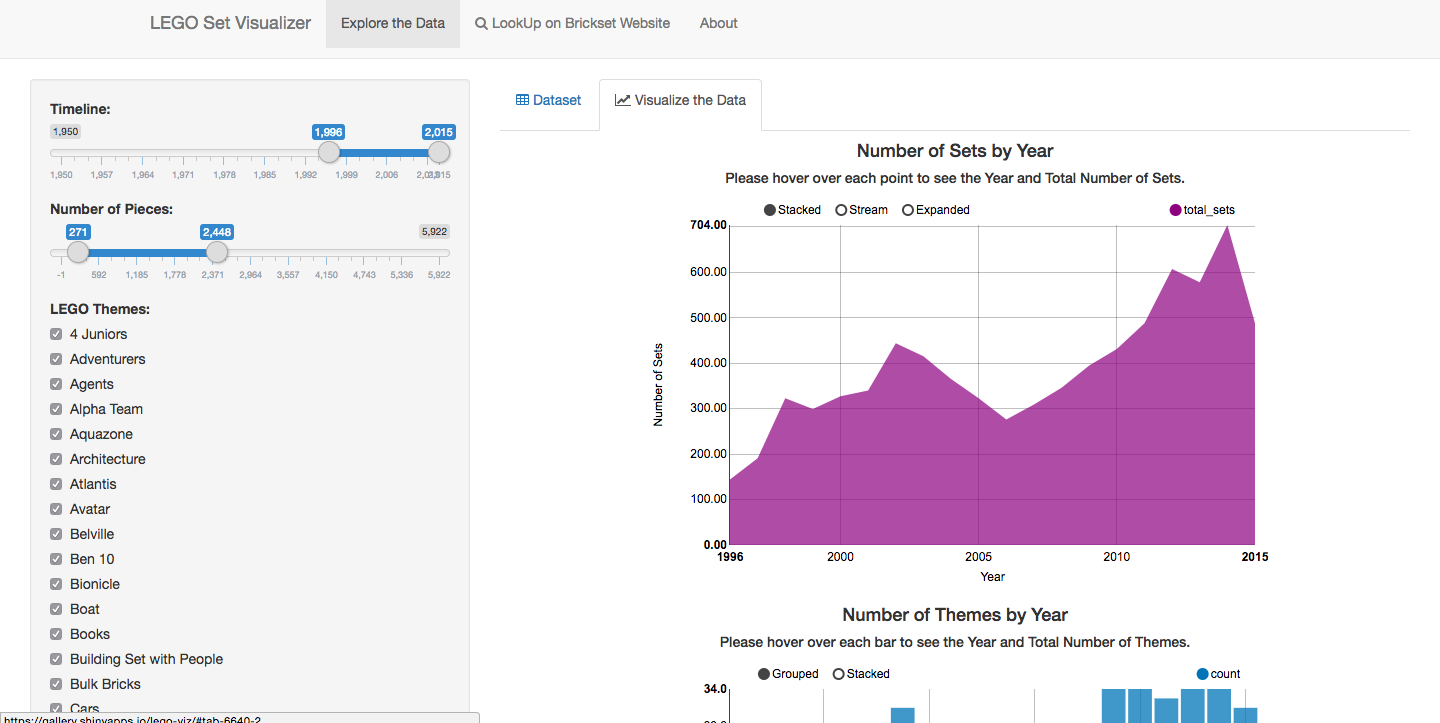
23. Lego Production Over Time
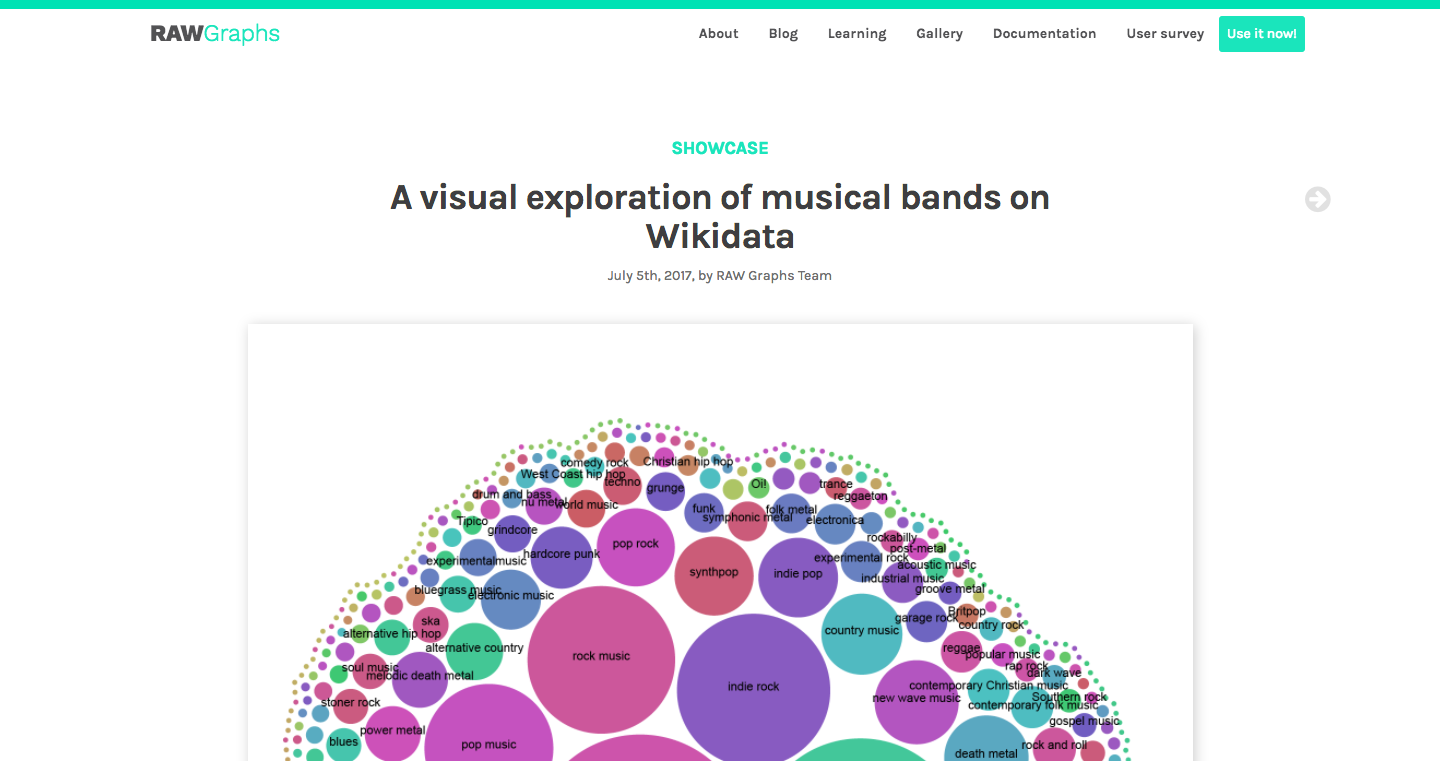
Rawgraphs
Rawgraphs, haven’t tried it out but looks promising. It provides a super simple interface where you’re able to drag and drop Excel and CSV data. This allows you to create better visualisations faster and without coding experience. Check out the tutorials to get up and running quickly > Rawgraphs Tutorials
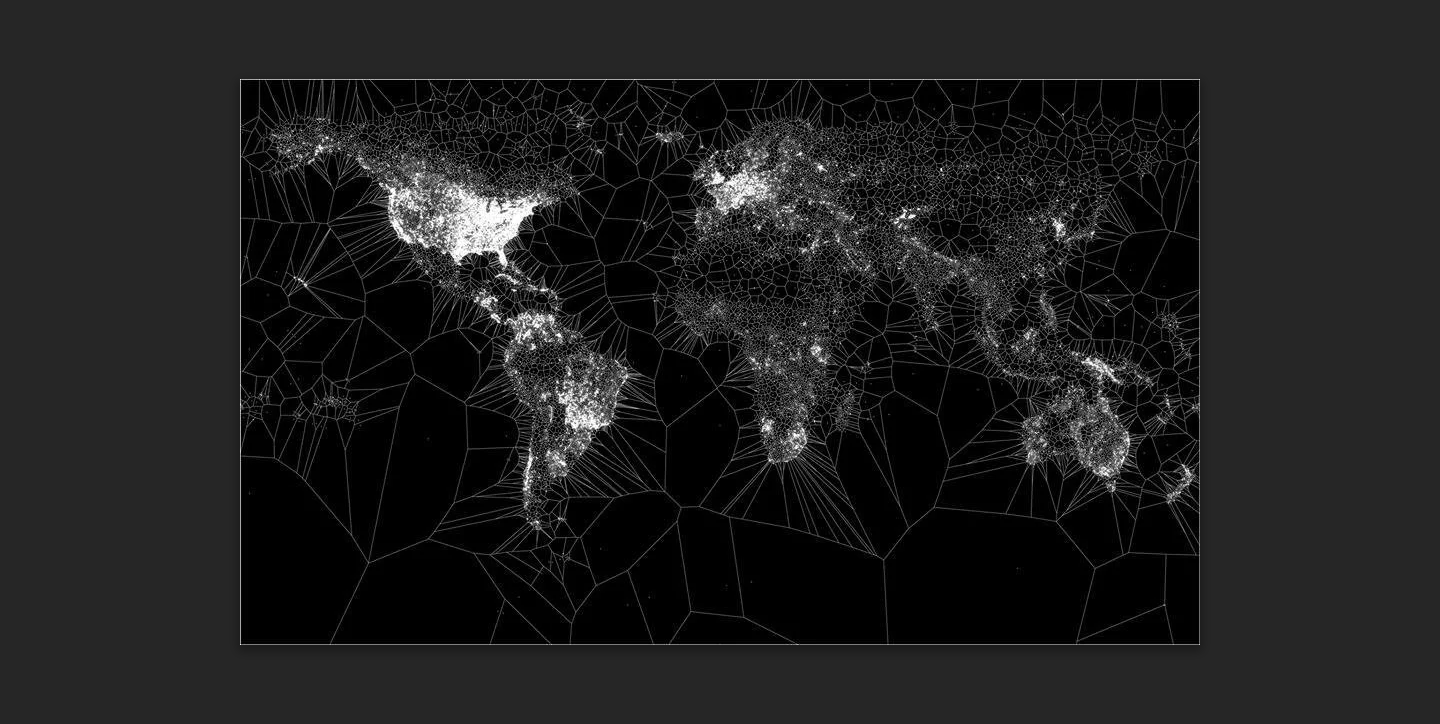
24. Airports around the world
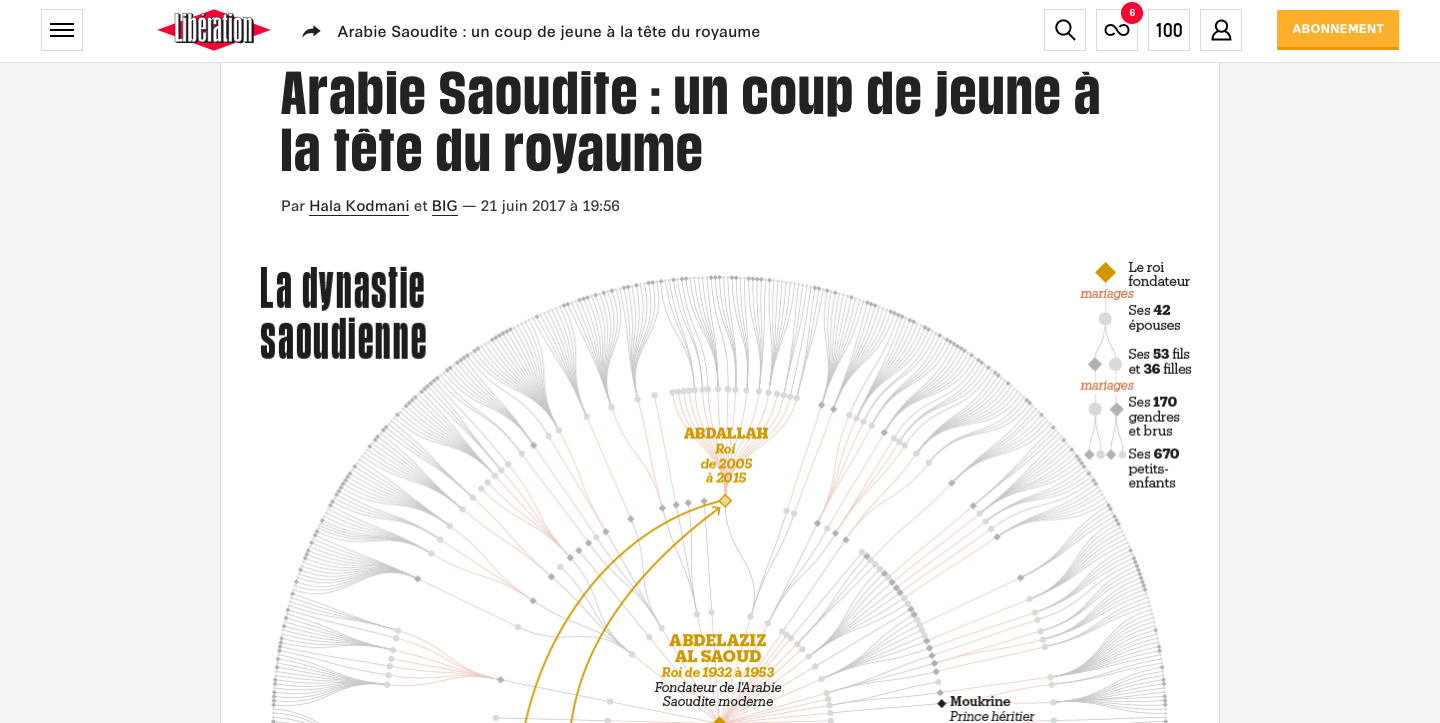
25. Saudi Dynasty (French)
26. Bands on Wikipedia
Plotly
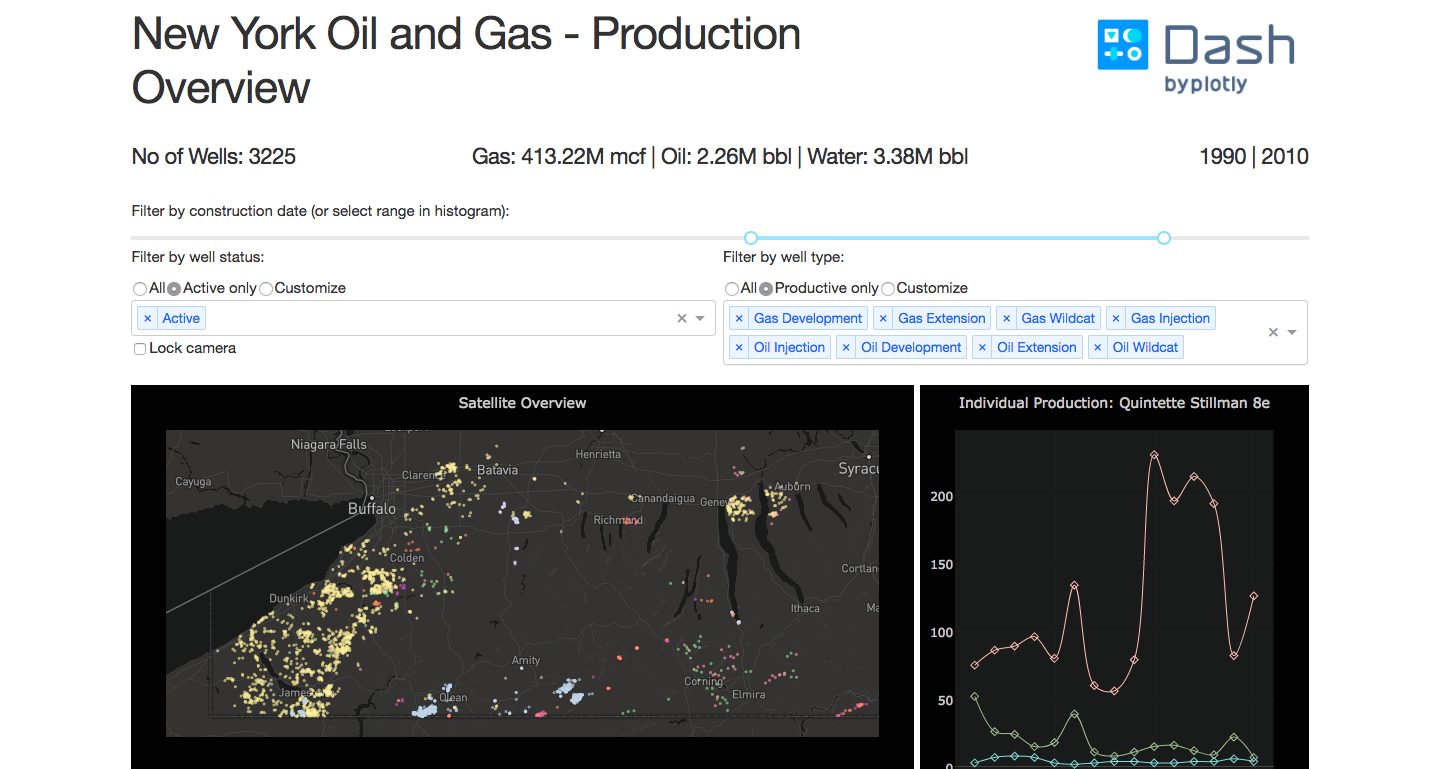
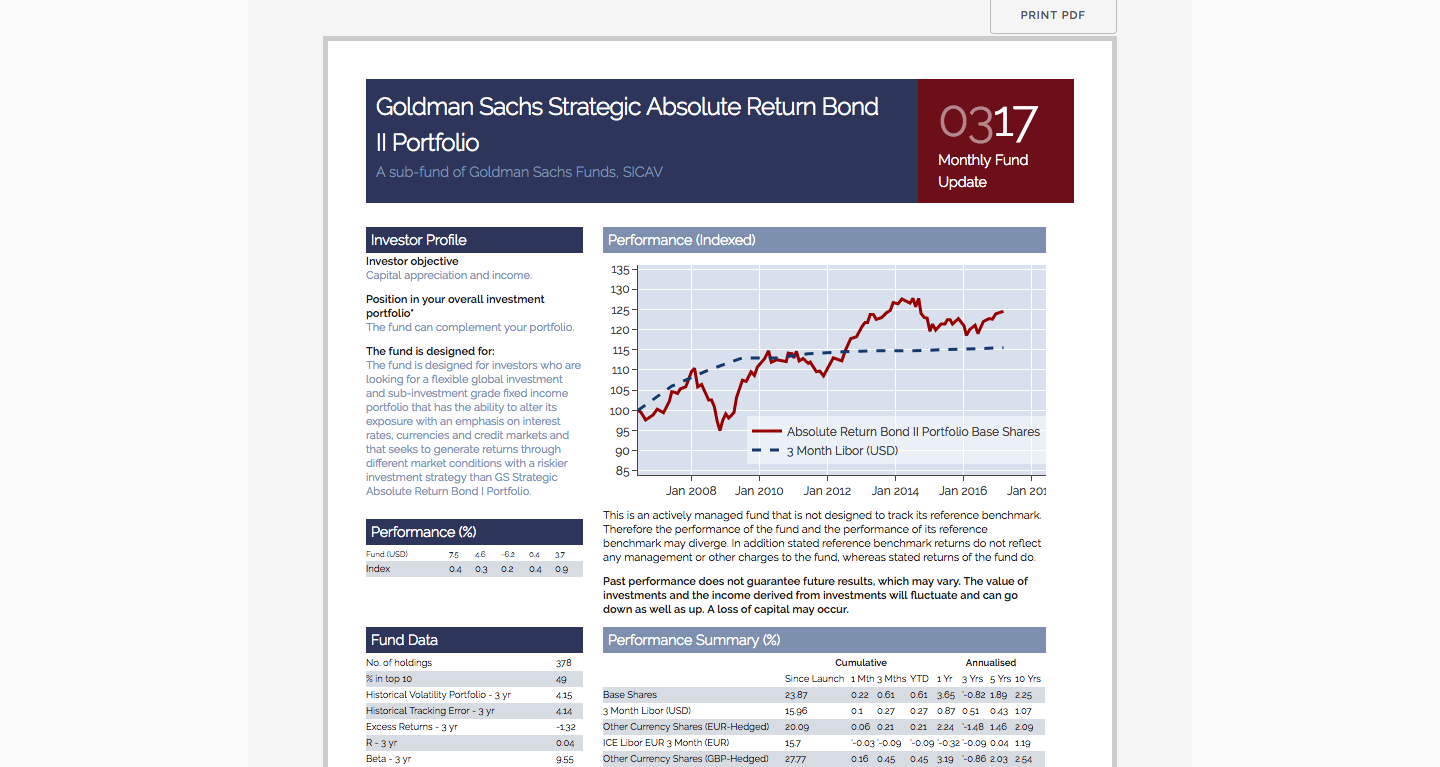
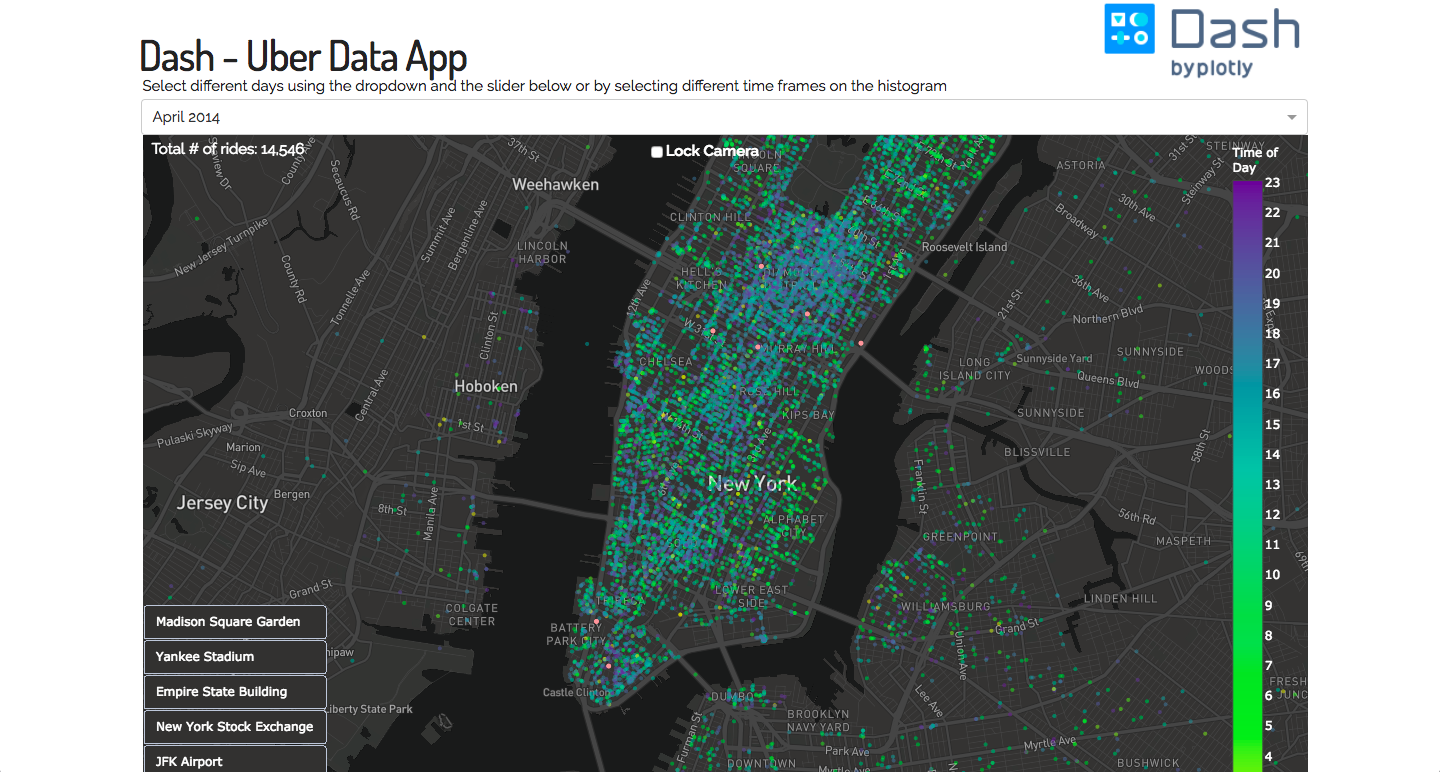
This is, without a doubt, one of the best plotting libraries out there. It integrates seamlessly with Python and Jupyter and has a whole spread of features. Whenever you show() a graph you’re able to save, zoom and pan automatically without any extra coding. These examples below show off some of the features using Dash, plotly’s open source web server.
27. New York Oil and Gas Production
28. Goldman Sachs Report
29. Uber Rides in New York
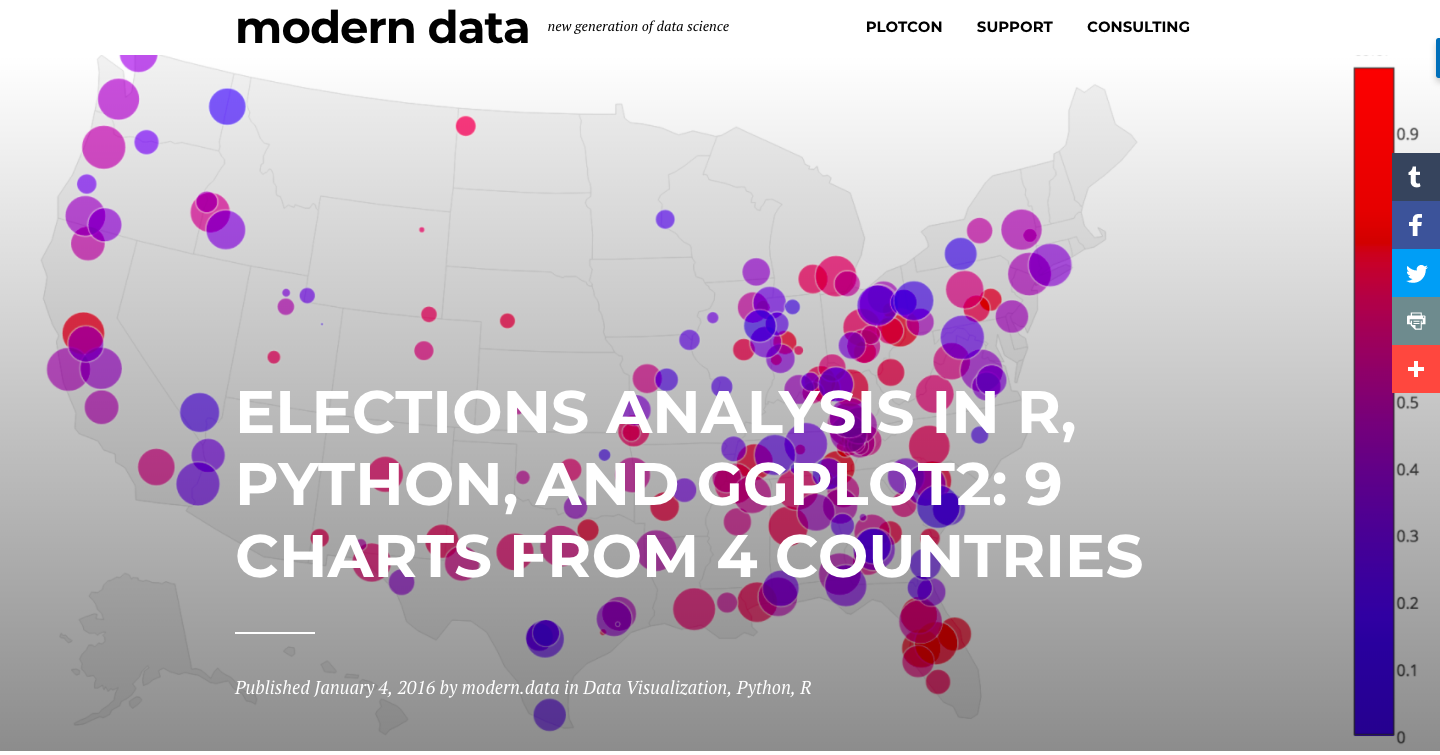
30. Election Data
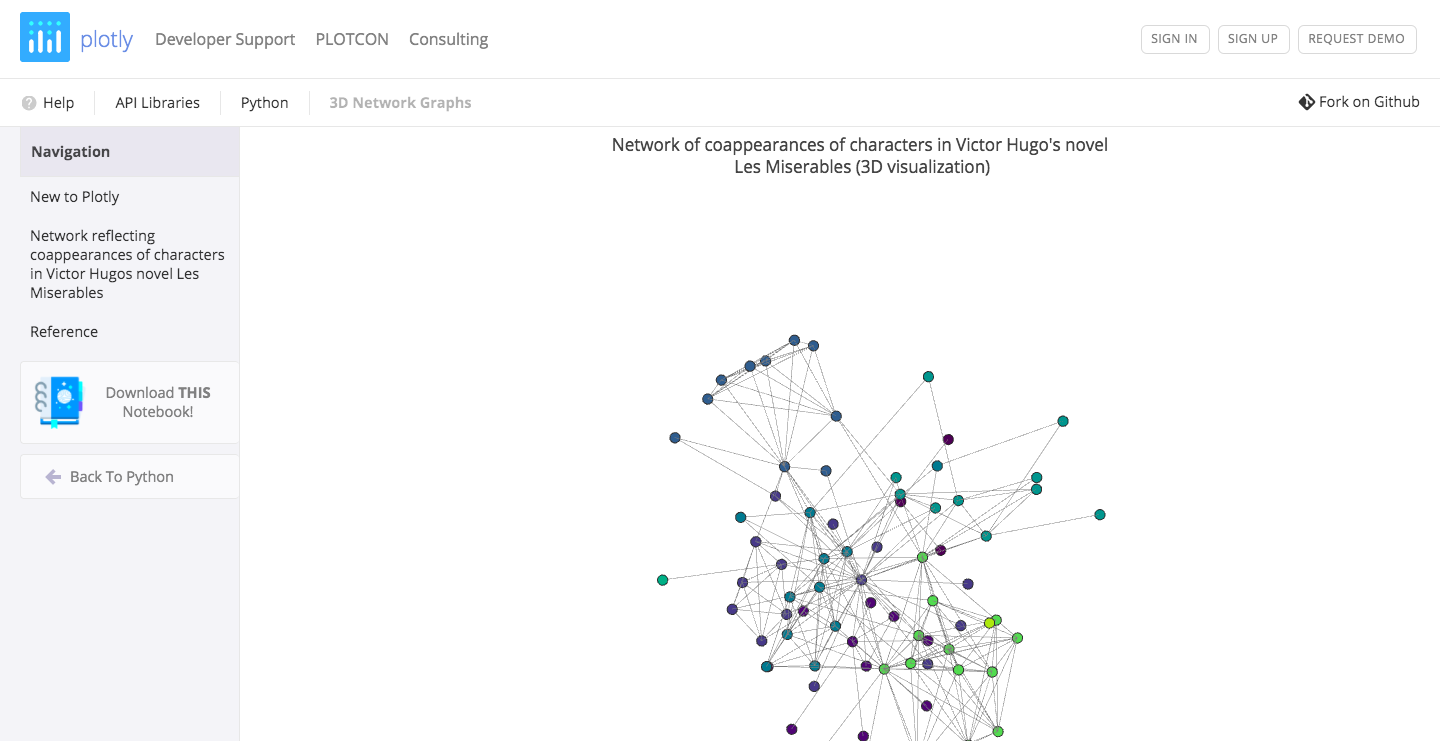
31. Coappearances of characters in Victor Hugo’s novel Les Miserables
Chart.js
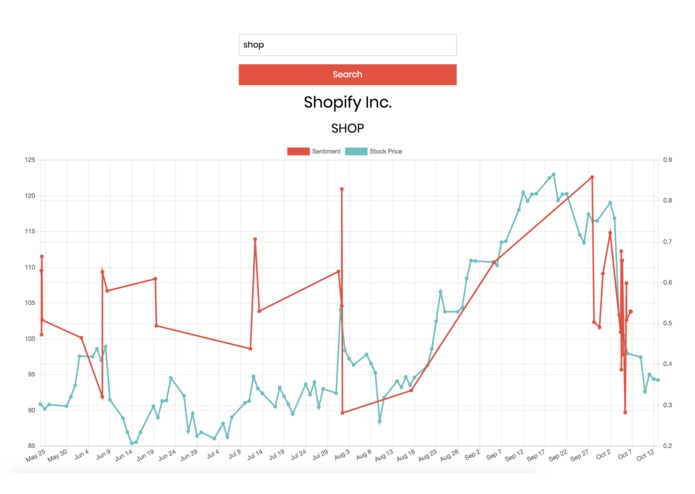
I wasn’t able to sentimentipede to run below but don’t let that distract you from Chart.js. This library is perfect for simple, flat-ui styled plotting.
32. Sentimentipede
Matplotlib
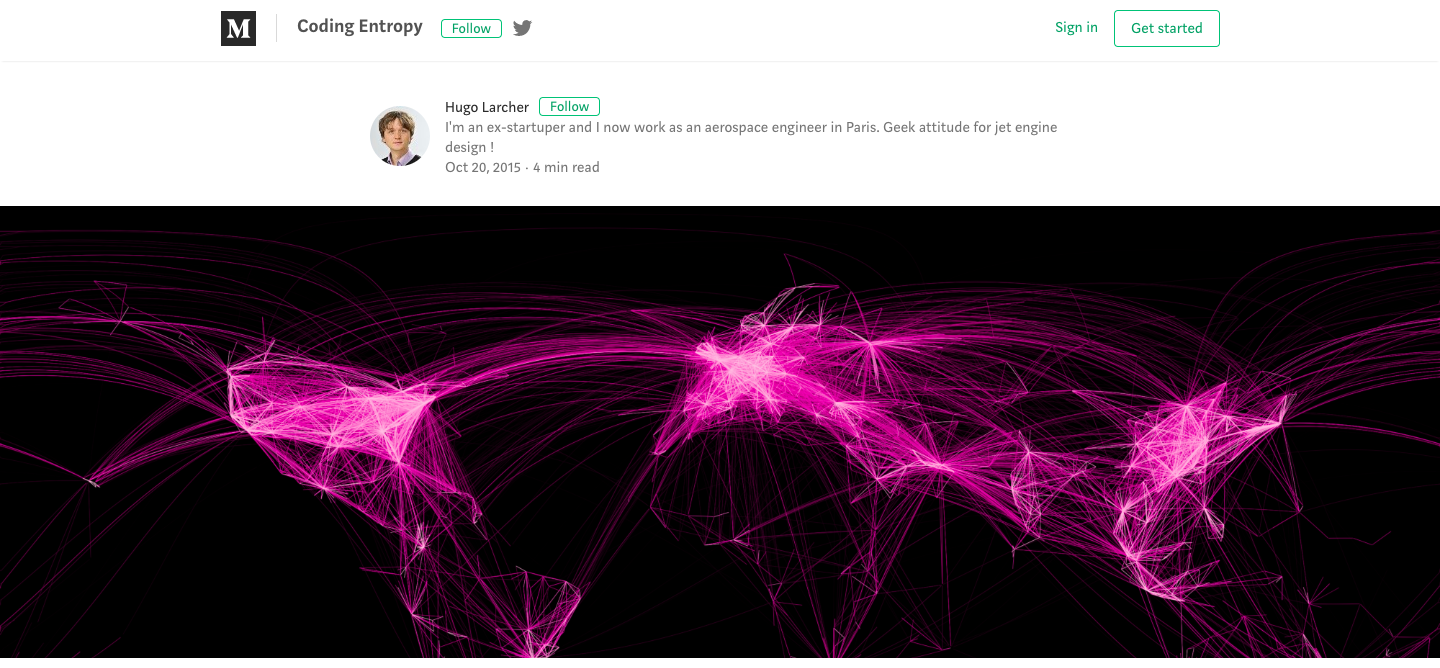
If you’ve done any data exploration in Python you’ve undoubtedly used Matplotlib at some point or another. I haven’t included many examples here but I thought this Flight Path Data viz showcases that it’s not just some-plotting-library-for-quick-plots.
33. Flight Data Paths
Mapbox
Mapbox is the geomapping library of all the geomapping libraries. It’s built into a host of enterprise grade software and for good reason. It allows you to create ridiculously accurate geo-based representations of data.
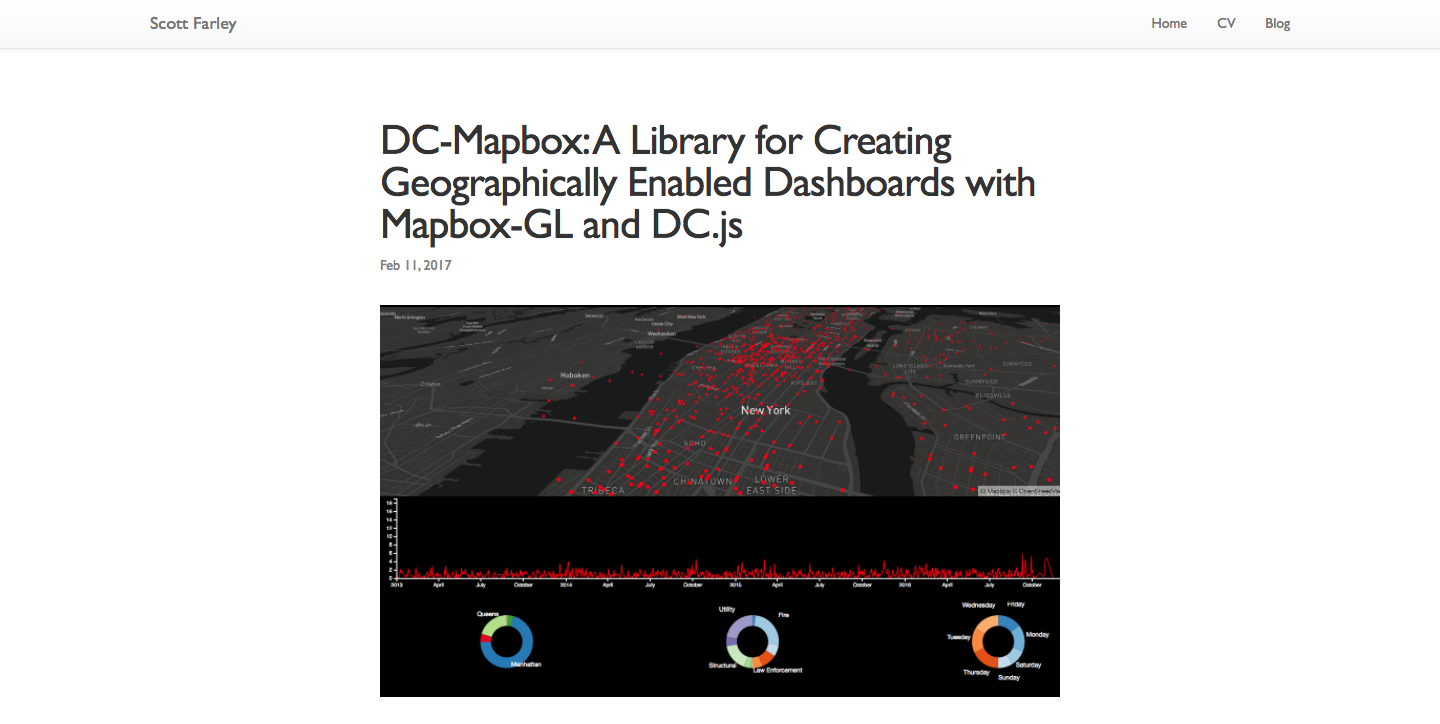
34. DC Mapping
35. 3D Structures
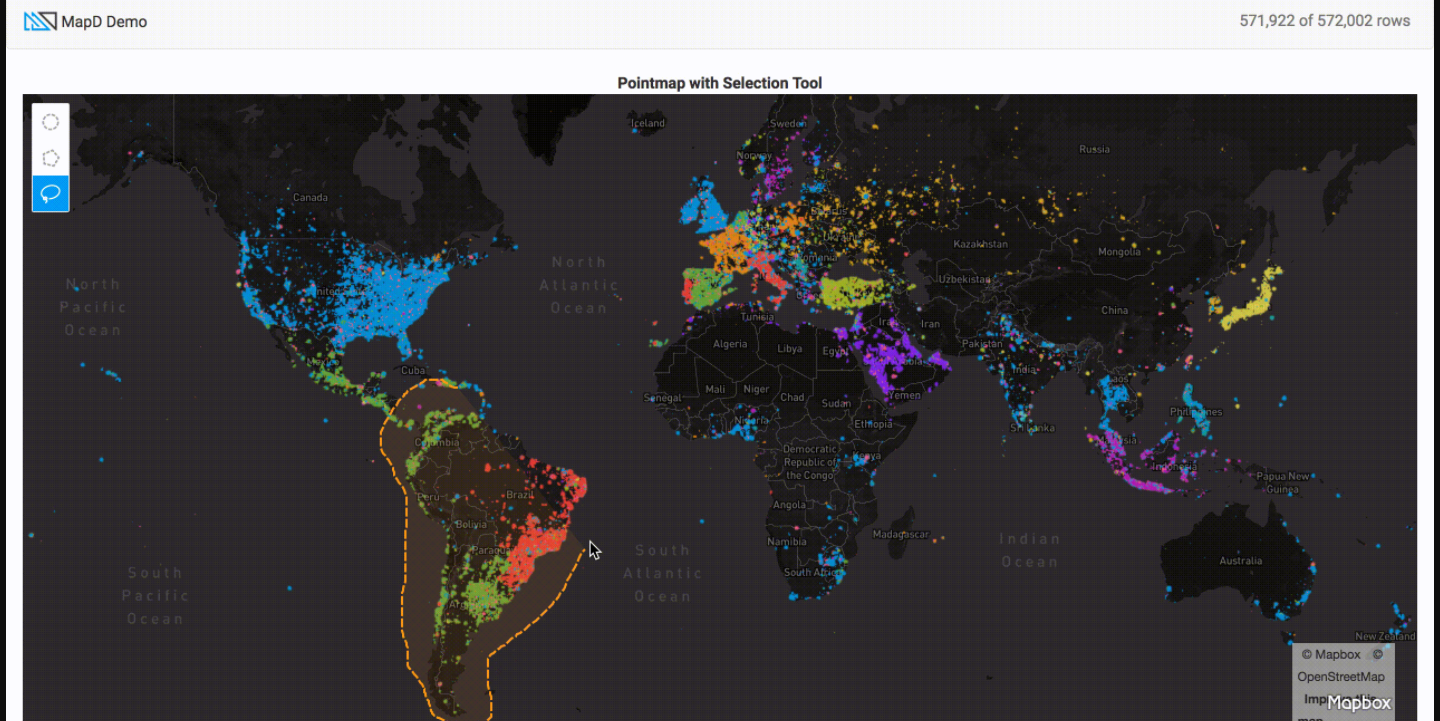
36. Interactive Selection
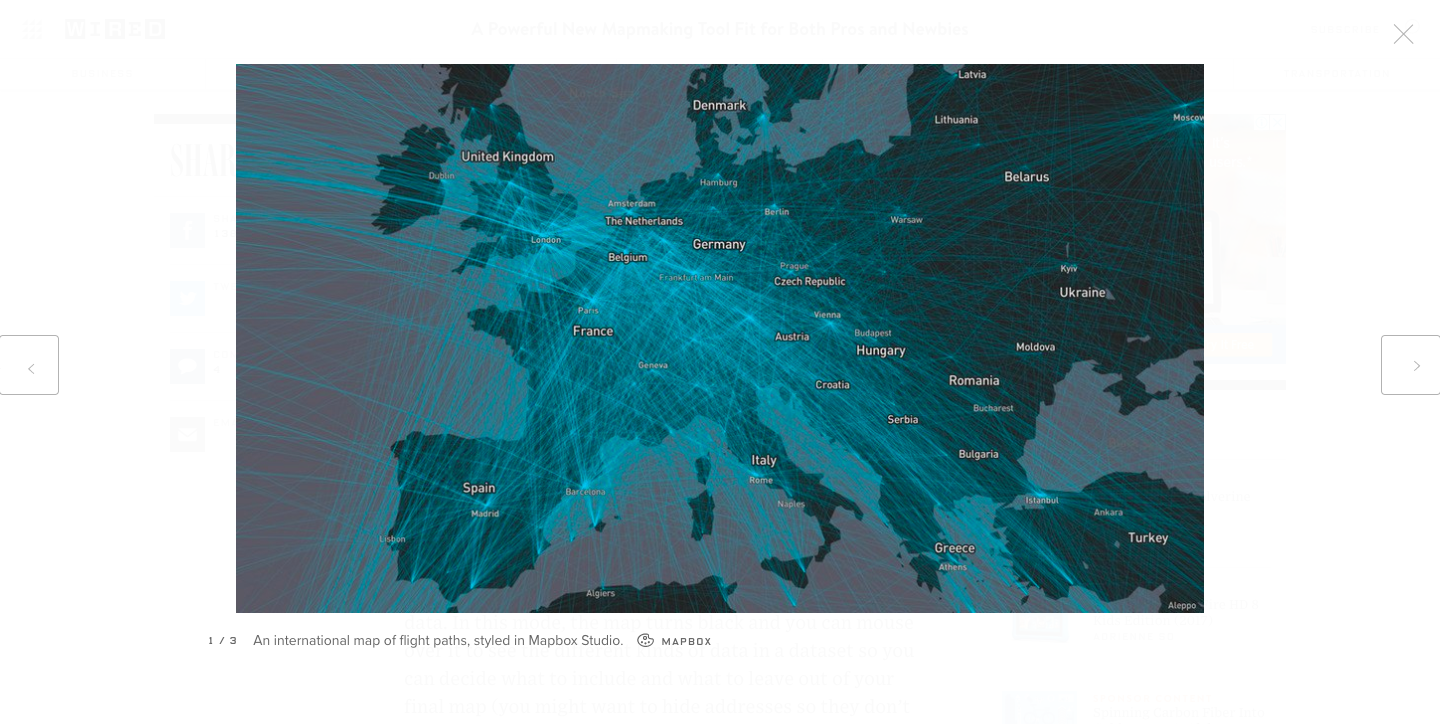
37. Flightpaths
There you have it. Those are just some of the other plotting options you have at your fingertips. Let me know if you know of any more!
